Supplemental Case. Worcester, Massachusetts tornado; 9 June 1953
The high-end F4 tornado that struck Worcester, Massachusetts around 2100 UTC on 9 June 1953 remains one of the
costliest and deadliest tornadoes in U.S. history. The tornado was responsible for 94 fatalities, 1288 injuries,
and property damage of over 52 million dollars (404 million in 2007 dollars) (StormData, SPC). The tornado's path
length (74 km), width (up to 1.6 km), and duration (nearly 90 minutes) are all extremely unusual for the NEUS. Two
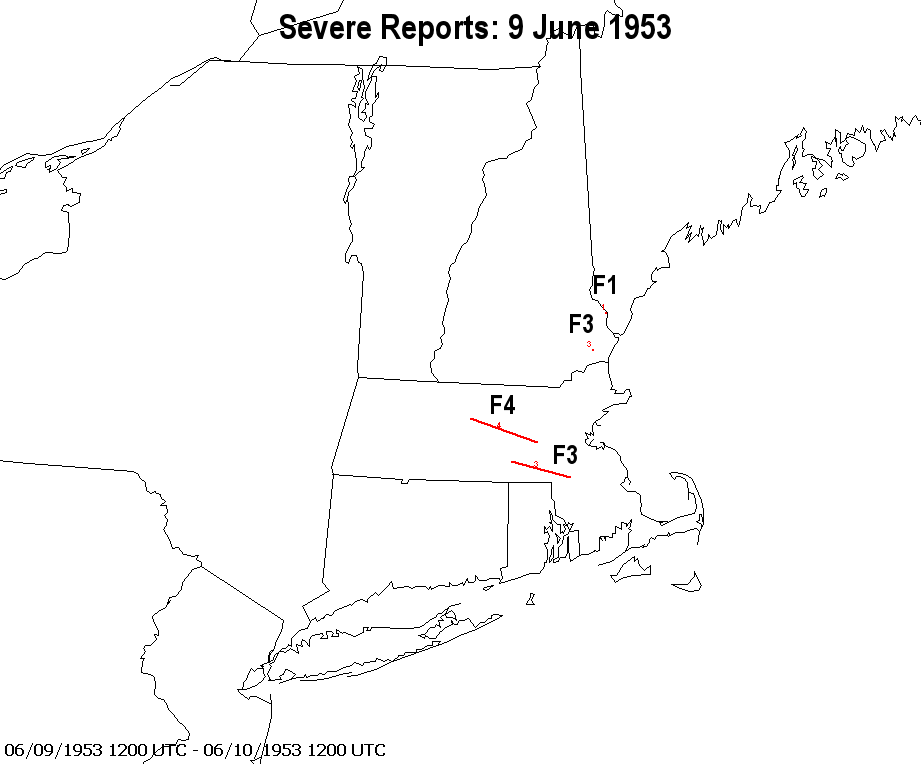
other significant tornadoes occurred on this day as well; a long-track F3 that affected portions of south-central
and southeast Massachusetts, and another F3 in Exeter, New Hampshire (Fig. S1). One of the most striking aspects
of the supercell was the visual similarity of the low-level mesocyclone and condensation funnel to what is often
observed with significant Great Plains tornadoes (Fig. S2).
The 700 mb rawinsonde plot on 9 June 1953 at 15 UTC (09/15 UTC) indicated relatively fast westerly
mid-tropospheric winds extending from the Great Lakes region eastward to the NEUS with a shortwave trough
translating east-southeastward over Lake Huron (Fig. S3). Lapse rates exceeding 7 oC km-1 in
the 700-500 mb layer extended from the Central Plains eastward to Southern New England. The backward trajectory
originating at 3 km suggested the source region of the EML was the southwest U.S., and the EML advected northeastward
over the course of 90+ h (Fig. S4). The trajectory also exhibited subsidence along most of its path, which aided in the
maintenance of the EML.
Observed soundings were examined at near-24-hour intervals along or near the trajectory to verify the presence of
an EML along the parcel's path (Fig. S5 a-d). The sounding progression starts with a deep, well-mixed boundary
layer at Phoenix, AZ (t - 90 h). This mixed-layer then was advected northeastward while becoming elevated over the
lower terrain east of the Rocky Mountains as shown in the Salina, KS (t - 66 h), Rantoul, IL (t - 36 h), and
Hempstead, NY (t - 12 h) soundings. The 09 UTC rawinsonde launched near JFK Airport in New York (Fig. S5d)
exhibited near-dry adiabatic lapse rates in the 700-500 mb layer above the stable boundary layer. The boundary
layer would eventually destabilize markedly across Southern New England with the onset of daytime heating and
positive low-level temperature and moisture advection in the wake of a surface warm front (Fig. S6). The advection
of the EML plume can also be visualized in the progression of 700 mb positive temperature anomalies, where
anomalies of +1 to +2 standard deviations from the 1961-90 climatological mean represent the approximate location
of the EML plume east of the Rockies (Fig. S7 a-d). The EML and associated capping inversion allowed for an
unusual buildup of strong potential instability which, when combined with strong low and deep shear, aided in the
unusual severity of this particular tornado event. The capping inversion associated with the EML plume also helped
allow for isolated cells, which likely contributed to the longevity and severity of each storm.

Figure S1. Severe weather reports for 9 June 1953. Tornado paths are shown with maximum F-scale rating.

FIGURE S2. Photograph of the "Worcester Tornado" near Lake Quinsigamond, Shrewsbury, MA at 2122 UTC on 9 June
1953. View is toward the North-Northeast. (Photo by Henry LaPrade).

FIGURE S3. The 700 mb rawinsonde plot at 15 UTC 9 June 1953. Each full (half) barb is 5 ms-1 (2.5
mS-1). The 700-500 mb mean lapse rate (oC/km, solid lines every 0.5 degrees) is
contoured.

FIGURE S4. The HYSPLIT model 96-hour backward trajectory analysis (plotted every 12 hours) starting at JFK, NY 09
UTC 9 June 1953. Trajectory 1 approximates the path of the EML plume in the middle troposphere (approximately 700
mb). Trajectory 2 represents the path of the 2 meter (surface) air parcel. Points a-d represent the rawinsonde
locations utilized in Fig. 14.

FIGURE S5. Soundings taken at points a through d along "Trajectory 1" in Fig. S4. The soundings are: (a) Phoenix,
AZ 03 UTC 06 Jun 1953, (b) Salina, KS 03 UTC 07 Jun 1953, (c) Rantoul, IL 09 UTC 08 Jun 1953, and (d) Hempstead,
NY 09 UTC 09 Jun 1953.

FIGURE S6. Standard surface analysis plot at 1730 UTC 9 Jun 1953 (from Penn et. al., 1955). Each full (half) barb
is 5 ms-1 (2.5 ms-1). Temperatures are in oF.

FIGURE S7. The 700 mb temperatures (oC, solid contours) and anomalies (standard deviations from the
1961-90 climatological mean, shaded) derived from the NCEP/NCAR reanalysis at (a) 12 UTC 06 Jun 1953; (b) 12 UTC 07 Jun
1953; (c) 12 UTC 08 Jun 1953; (d) 12 UTC 09 Jun 1953.
|
REFERENCE
Penn, S., C. Pierce and J. K. McGuire, 1955: The squall line and Massachusetts tornadoes of 9 June 1953. Bull.
Amer. Meteor. Soc., 36, 109-122.